With version 99 of Microsoft Edge, DevTools can securely download source maps from the Azure Artifacts symbol server. This means you can use Azure Pipelines to publish source maps to a secure location, and have DevTools retrieve them at runtime and offer a familiar debugging experience by displaying your original source code.
In this post, Rob Paveza from the DevTools team will walk you through how to configure this feature, how it can help your in-production debugging, and where we plan to go from here.
When I first joined Microsoft, an early task for me – and for many new hires – was to triage and possibly fix bugs. What’s happening? What’s the root cause? Is it user-visible?
Windows crashes are reported via Windows Error Reporting, and it’s amazing really how little information is required to stitch together a call stack of the code that was running when the crash happened, just memory offsets and the set of loaded modules in a process. For a particular crash report, we’d attach WinDbg, and like magic, we’d get a good call stack, and we could click through it to see the exact lines of code in the exact version of our DLL running on the customer’s machine. It might not have any other data, but especially for things like null-pointer dereferences, it was brilliant.
All of this was provided by a series of technologies:
- The build system would produce symbol files for Windows native code.
- The release system would then index the source code, built modules, and symbol files.
- The Windows Error Reporting crash analysis system would send crash reports to us.
- The debugger knew how to talk to the Symbol Server where sources and symbol files were located.
If you are a JavaScript developer, you might recognize some corollaries for some of our technologies. When we compile from TypeScript or Dart for example, or run our code through a bundler, we produce source maps. Our debuggers know how to read source maps, and the source maps are self-contained with the original source code.
But there are pieces missing. One of the most common things we see today is that source maps get published adjacent to their JavaScript bundles. But this isn’t an ideal solution for every developer, particularly because it’s common that source maps contain original source code, which not all developers may want to host on their web servers.
Teams across Microsoft encountered this issue. One team published their source maps to an Azure Storage account which had access restricted to certain IP address ranges. But this solution isn’t really scalable and it isn’t generalizable. When we realized that we had already solved this problem for native code, Microsoft engineers across Office, Azure, and Edge collaborated to close the gap on these pieces, and we realized that it might be useful to other developers as well.
Secure source maps in production
With version 99 of Microsoft Edge, DevTools can securely download source maps from the Azure Artifacts symbol server. This means you can use Azure Pipelines to publish source maps to a secure location, and have DevTools retrieve them at runtime and offer a familiar debugging experience by displaying your original source code.
But this is only a first step for us. We’re very interested in hearing feedback from you all about the services, other than Azure, which you might want to retrieve source maps from (more on that at the end of this article). Please let us known by commenting on this GitHub issue.
One of the advantages the Windows module file format has over JavaScript is that the format has a definition of metadata. This is specific information about memory layout, version, etc., whereas JavaScript files are just text. If you’re lucky, you might have a Byte Order Mark, and you might include a //# sourceMappingURL comment at the end of the file – but this is still embedded in JavaScript itself.
Microsoft Edge, starting in version 99, allows the Developer Tools to leverage one more piece of metadata that might be available: a hash of the file contents, and then use this hash to securely download source maps from the Azure Artifacts symbol server in DevTools.
When a JavaScript file is successfully parsed and DevTools are attached, a SHA-256 hash of the file contents will be computed, and DevTools will track that for the lifetime of the page. DevTools can then use this as the index for the source map – so that the exact version of the running file maps to the exact version of the source map. Using this index, DevTools can download the required source maps and offer a familiar debugging experience by presenting the original source code to the user.
Getting there
The following 3 steps are prerequisites, but in practice, they will only need to be performed once per project by manipulating the build process in some form. You can also refer to our documentation for more information.
Step 1: Indexing source maps
Noted above, the SHA-256 hash is the value used as the index by which the source maps are searched. The source map, however, doesn’t have a built-in notion of what this hash is.
The easiest way to on-board the source map index is to add a property to your source map — x_microsoft_symbol_client_key. This should contain a lowercase hexadecimal representation of the SHA-256 hash of your script. This should happen as late in the build process as possible, because modifications to the JavaScript files will necessarily change the hash
Thus, if you have a script file “index.js” with a hash of abc10204bcd21215cde32326def43437abc10204bcd21215cde32326def43437, the “index.js.map” file should have the field added to it:
{
  // …
  "x_microsoft_symbol_client_key":
    "abc10204bcd21215cde32326def43437abc10204bcd21215cde32326def43437"
}
Step 2: Making source maps available on Symbol Server
After adding the index keys to the source maps, we have what we need to publish them for access.
Publishing with Azure DevOps Pipelines
Azure DevOps Pipelines provides a convenient way to on-board your source maps to the Azure Artifacts Symbol Server. If you’re already using Azure DevOps Pipelines to build your web application, it should be as trivial as adding a new task into the pipeline and telling it to publish JS Source Maps (the default is PDBs).
If you are using this task, you should add this after you have added the x_microsoft_symbol_client_key field to your Source Map payload.
Alternative: Manually Publishing with Microsoft Azure Artifacts Symbol Server
Discussing the specifics around Azure Artifacts is a bit out of scope for the purpose of this document. It’s sufficient to say that it’s effectively a secure file storage service, and Edge DevTools knows how to talk to it. You can learn more about this service specifically at Symbol files – Azure Artifacts.
If you are unable to use the pipeline task or Symbol.exe tool for some reason, the Azure Artifacts Service has a REST-based API that can be used. The “debug entry client key” used by the Symsrv protocol is generally of the format <source map file name>/<hash>/<source map file name>.
Step 3: Connecting Microsoft Edge to Azure DevOps
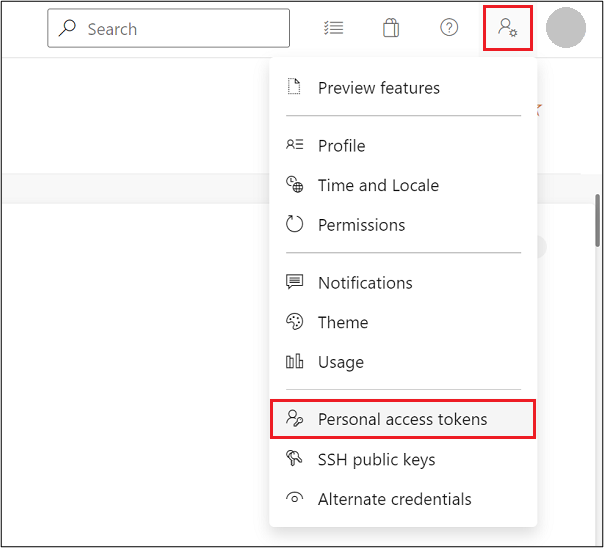
This is reasonably straightforward and requires a Personal Access Token, or PAT. To do so, open your Azure DevOps website and search for the User Settings menu, typically adjacent to your user profile picture. Open the menu and click Personal access tokens.
From here, name the token and give it an expiration date as appropriate. Click Show all scopes near the bottom of the dialog window, and near the end of the list of scopes select Read in the Symbols scope. Finally click Create to create a PAT.
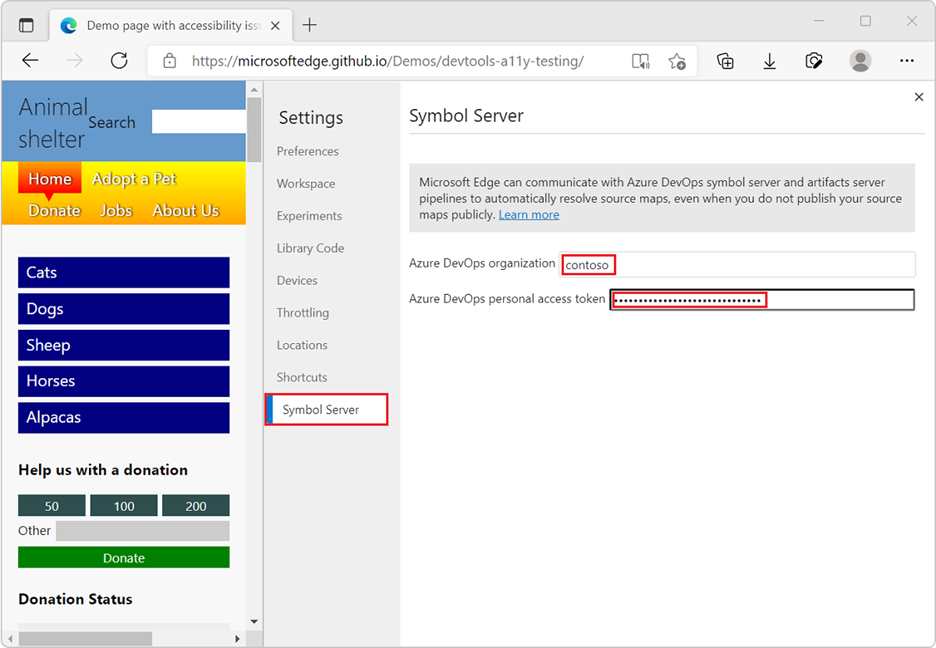
Then, in Edge DevTools, go into the Settings (F1), click the Symbol Server tab, enter the name of your Azure DevOps organization (if you interact with Azure DevOps at, for instance, contoso.visualstudio.com, then the organization is “contoso”) and paste your PAT into the appropriate box. Close the Settings panel and click the Reload DevTools button.
Now, when debugging an official build of your website, for which debugging symbols have been published, your original development source files will be used in DevTools. They will be downloaded securely from the Azure Artifacts symbol server by DevTools and displayed in the Sources and Console tools when debugging code.
Next steps
Source maps haven’t evolved much since 2011, but we’re engaging with the community to try to improve them. In Microsoft Edge 99, we introduced the ability to retrieve them for in-production debugging, and in Edge 100, we now also include metadata about your active scripts as part of exporting Performance traces. This will allow you to get the right source maps loaded to view a performance profile with the code that ran at the time it was captured.
In the future, we also would like to make it possible for Edge DevTools extensions to resolve source maps from stores other than Azure DevOps. There isn’t any define date for this yet, and we would love to hear your feedback about it first. Please feel free to drop us a comment on this feedback GitHub issue.
We are also planning to improve caching for Source Maps. We’ve heard feedback that downloading source maps can take a long time and we’re experimenting with bypassing the HTTP cache altogether in favor of a keyed index. We don’t have a timeline for this yet either.
Finally, we’re also actively engaging with the TC39 Tools Working Group and interested members of the JavaScript community to determine how to enhance Source Maps with additional information. This should help improve the kinds of experiences you’re able to get while debugging, whether it’s live or in crash analysis. Please join in on the discussion if this is interesting to you.
– Rob Paveza, Principal Software Engineer, Microsoft EdgeSecurely debug original code by publishing source maps to the Azure Artifacts symbol server
Source: Windows Blog
—

